An Inside Look at 3 Leading Business Intelligence Tools
Understanding the features of BI platforms from Microsoft, Qlik and Tableau can help organizations make the best choice for their operations.


Using data to improve operations seems like a simple idea. But many organizations struggle to achieve this goal because they have trouble clearly understanding how operations perform when their data is scattered across multiple systems. Even when these systems have reporting built into them, their closed and static nature makes it difficult to find the answer to the next question you may have after seeing the initial information.
For example:
- Sales are down in the West, but why?
- Costs of surgeries are soaring. Where can we streamline?
- We have great programs to help struggling students, but which students should we focus on?
Modern data visualization and business intelligence platforms address these challenges. These systems pull together disparate data sources to provide a single source of truth and offer the flexibility to drill into the data and answer the next question. For a school district in Washington, using BI helped improve graduation rates from 55 percent to 82.6 percent. For a hospital in Texas, it provided insight into sedation use and improved patient outcomes. For a credit union in Indiana, it improved customer service and boosted revenue.
With BI solution and services, organizations can achieve great things. But how do you select the right solution in a crowded market? Let’s look at some of the strengths of three BI solutions that have been recognized by Gartner as leaders for at least four consecutive years:
Microsoft Power BI
Microsoft provides the lowest-cost individual licensing of these three solutions, and for companies that use Office 365, the service is directly integrated with other Office 365 offerings. Microsoft also has the broadest set of analytics offerings, so as organizations expand their efforts to leverage a data warehouse or data lake or want to take advantage of machine learning and AI, they can do so using additional Microsoft services, rather than integrating solutions from other vendors.
Last, despite its low cost, Microsoft aggressively enhances the product with monthly releases. These have even included more advanced analytics capabilities, such as the new key influencers capability.
Qlik Sense
Of these three solution providers, Qlik Sense has had the longest presence in this market. You’ll find communities where customers share best practices, such as within the healthcare industry. Qlik offers a completely web-based experience, so while you can try out solutions with a Windows-based desktop client, Qlik can be used entirely through a web browser.
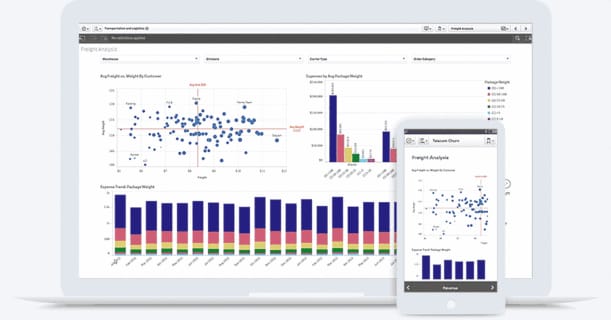
Click to watch the program in action. SOURCE: Qlik
Once deployed, Qlik dashboards (or apps) provide an interactive user experience with intuitive selection options, clear breadcrumbs and interconnected visualizations. A powerful search feature makes it even easier to filter dashboards to answer specific questions. Qlik’s unique associative engine can often highlight issues with dirty data that customers don’t realize they have. For example, one organization found that its total sales by category added up to a different number than its total sales. Qlik’s associative engine made it clear the issue was with the data source — a number of sales transactions where the category hadn’t been recorded. Qlik recently acquired a chatbot solution that makes it even easier for business users to question and receive answers from their data.
Tableau
Tableau is widely regarded as the most user-friendly and powerful data visualization development client in the industry. It is the only vendor of the three to have a native desktop client available for Windows, Mac and Linux. The unique drag-and-drop development environment, along with extensive help and training materials, allow users to get off the ground quickly.
In addition to its ease of use, Tableau provides a wide variety of visualizations and enhances any individual visualization to make it data-rich and informative. Tableau also has intuitive features to enable advanced analytics of the data, such as linear regression and clustering — capabilities that typically would require the involvement of a data scientist or use of additional analysis tools.
Next Steps
What’s the right solution for your organization? Check with your CDW account manager — we can do a deep dive into these solutions or others that might be a better fit for your organization. Our analytics solution architects will work to understand your needs, establish your position with current investments in technology and people, and help you determine the right solution, along with a roadmap forward.